A Brief Summary of My Research Project
Overview
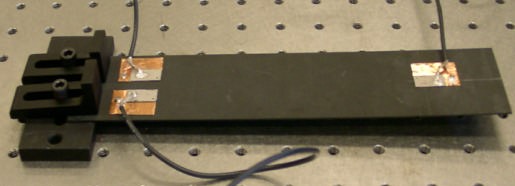
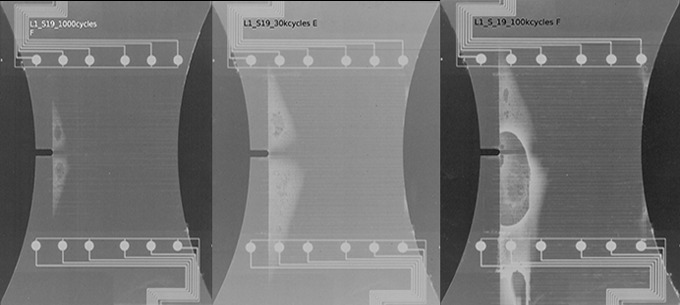
Lamb-wave-based structural health monitoring in polymer composites is a popular topic in recent years. In this method, lamb-wave actuators are placed on one end of the composite specimen and the sensors are placed on the other end. Any damages, such as cracks or delamination on the specimen, are shown to be manifested in the distortion of the Lamb-wave signals. However, there has not been a solid mathematical model to interpret these signals into meaningful information (damage levels). Therefore, Dr. Liang and his students from the University of Manitoba decided to solve this problem using machine learning. A data set of CFRP X-ray images and corresponding Lamb-wave signals were provided by NASA (https://ti.arc.nasa.gov/tech/dash/groups/pcoe/prognostic-data-repository/). However, these X-ray images were not labelled; the computer can not understand the damage level just by looking at the images. Thus, my role is to create an automated system to label the damage levels on these images, which later can be used to train the machine learning model.
Two indicators could be used to evaluate the damage of the sample: the delamination area and the cracks count. Determining the delamination area from X-ray images was challenging, as the shape and tone of the delamination area did not follow any simple rule. Therefore, in this project, the crack count was computed and used to evaluate the damage level of the composite.
Methodology
The process of computing the number of cracks consisted of two main steps: cropping the X-ray image and counting the horizontal cracks on the image.
The first step was to crop the original X-ray image. The cropped image must have the cracks as its only feature, since any other features, such as the delamination area or the boundary of the sample, would complicate the counting process. The cropped image was limited by the two horizontal white lines, the edge of the delamination area, and the edge of the composite sample.
To get the coordinate of the white lines, the raw image was binarized into black and white pixels. The sum of white pixels within each row was computed for every row of pixels. A large number of white pixels in a row indicated the white lines. Most of the time, there were more than two white lines detected, two lines whose gap between them was larger than half of the image were the boundaries of the desired cropped area.
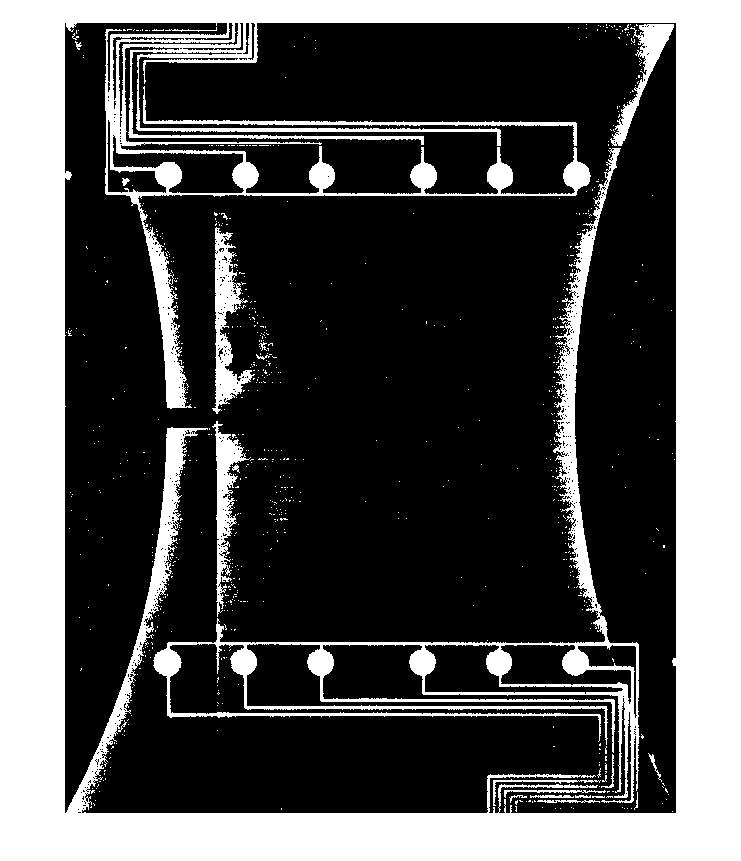
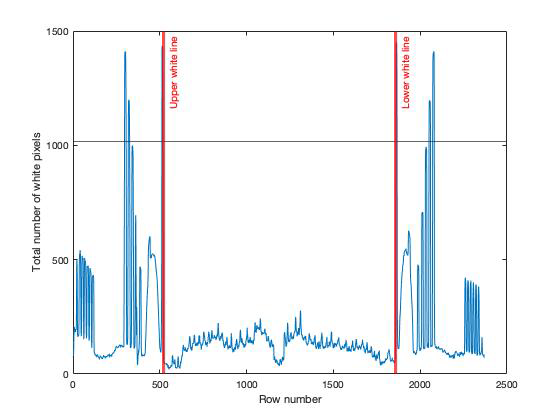
Similarly, to find the edge of the delamination area and the sample, the same technique was used for every column of pixels. To reduce the noise from the white pixels outside the two horizontal white lines, the image was cropped using the white lines coordinate found in the previous step.
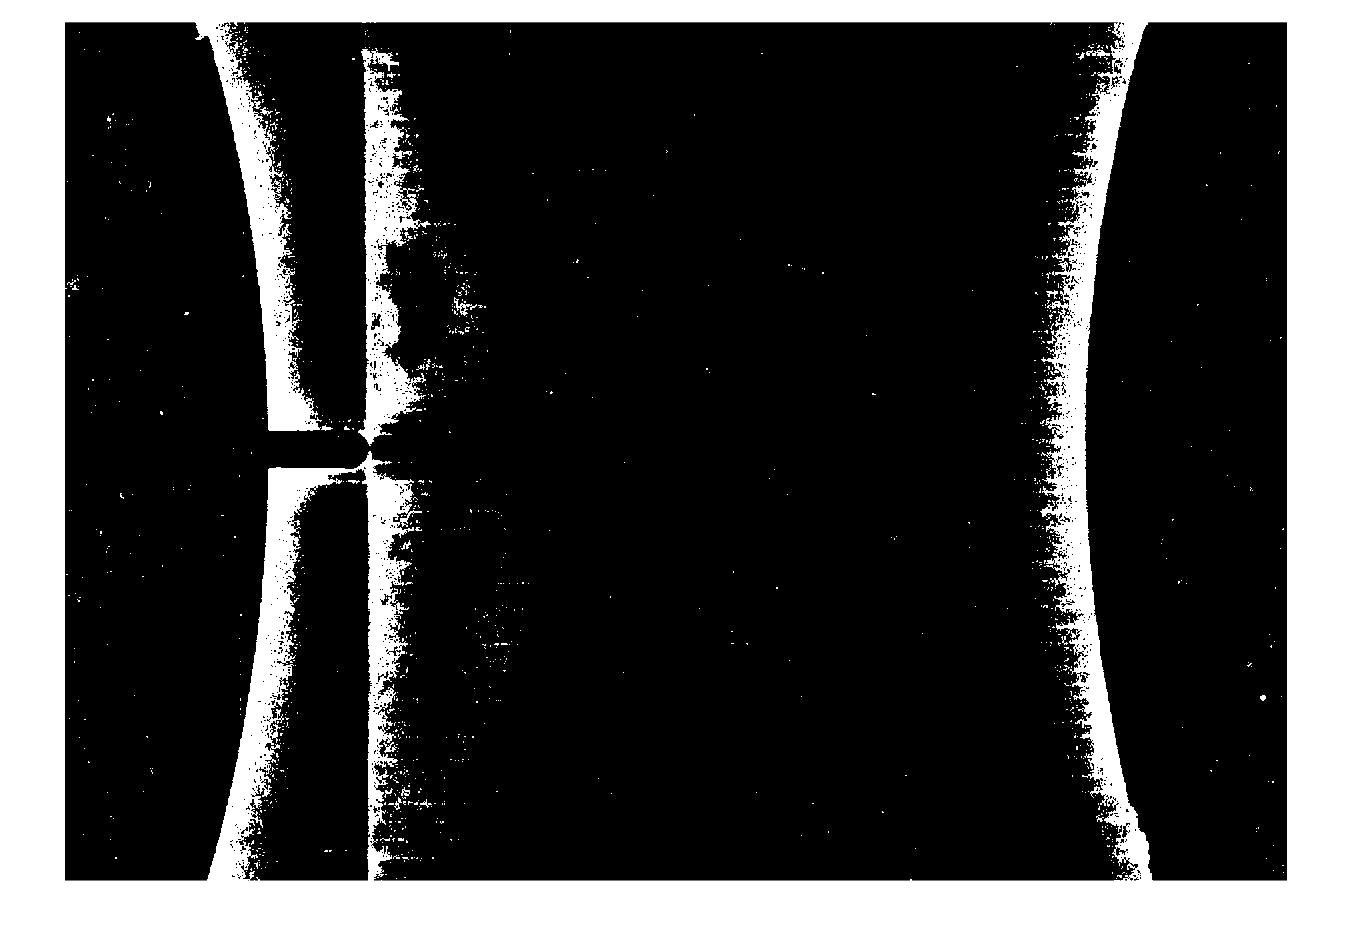
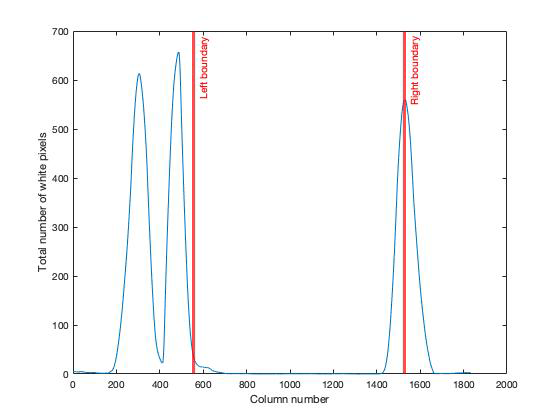
In the figure above, the first, second, and third peaks indicated the left edge of the sample, the delamination area, and the right edge of the sample respectively. The edge of the delamination area and the right edge of the sample were used to further crop the original image.
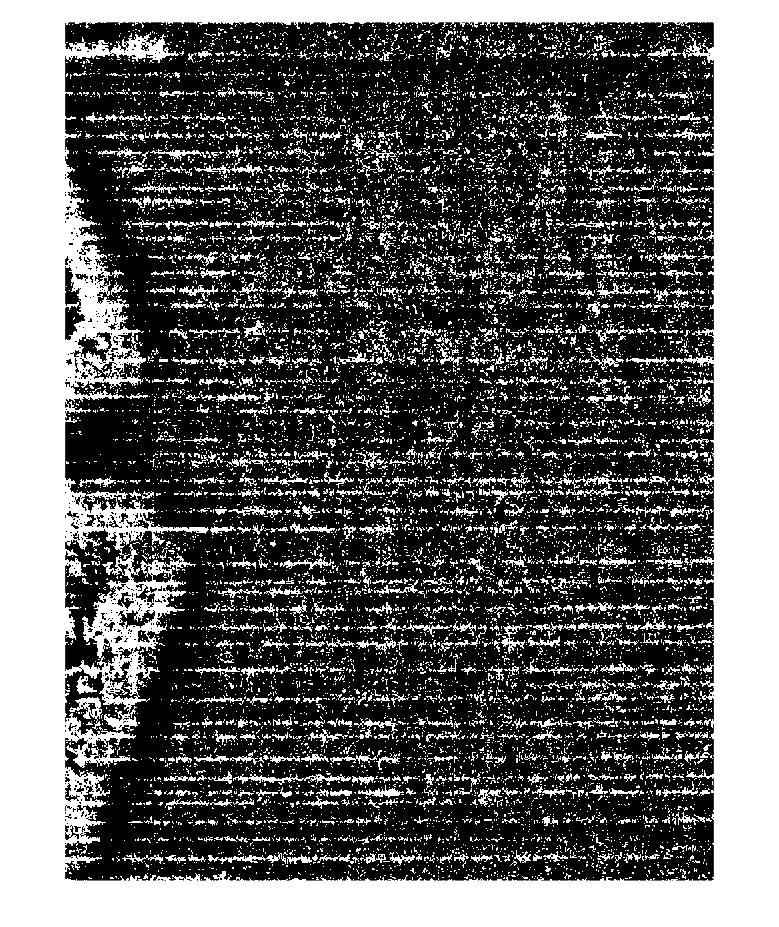
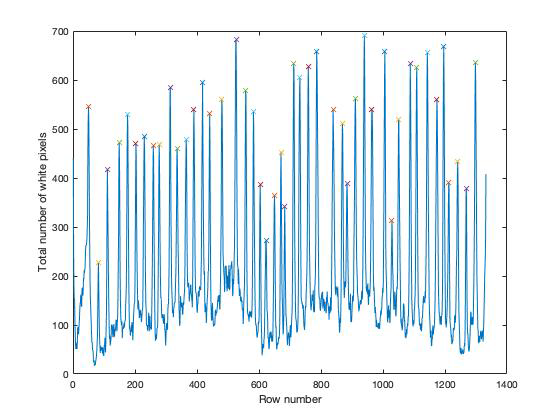
The cropped image was then binarized to highlight the horizontal cracks. Similar to the technique used to find the white lines, the total number of white pixels was computed for each row of pixels. Each data peak indicates a crack. The total number of cracks within the boundaries was then counted.
Results
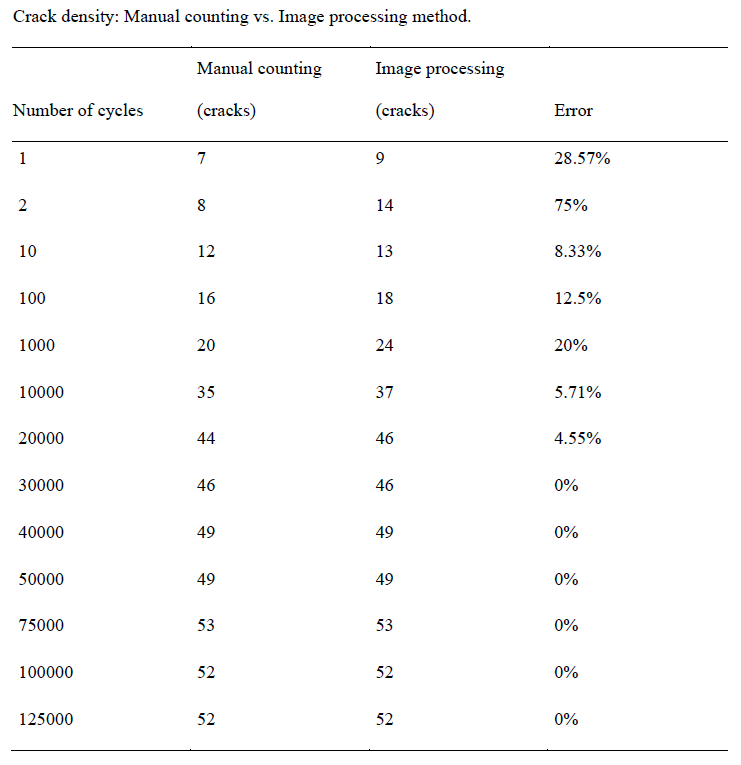
The reference data was gained by the manual counting process. The results from the automated method are then compared and verified.
Discussion
At a small number of cycles (under 10000 cycles), the cracks only appeared on the two edges of the sample and had not developed into their full length, which made the counting process changeling (for both manual and automated). For a high number of cycles, the algorithm yielded very accurate results, compared to the manual counting process.
Unsuccessful methods
A similar method was attempted to define the delamination area boundary; however, the boundary of the area was not accurately defined. This was due to the inaccuracy of the binarizing process discussed on the next part.
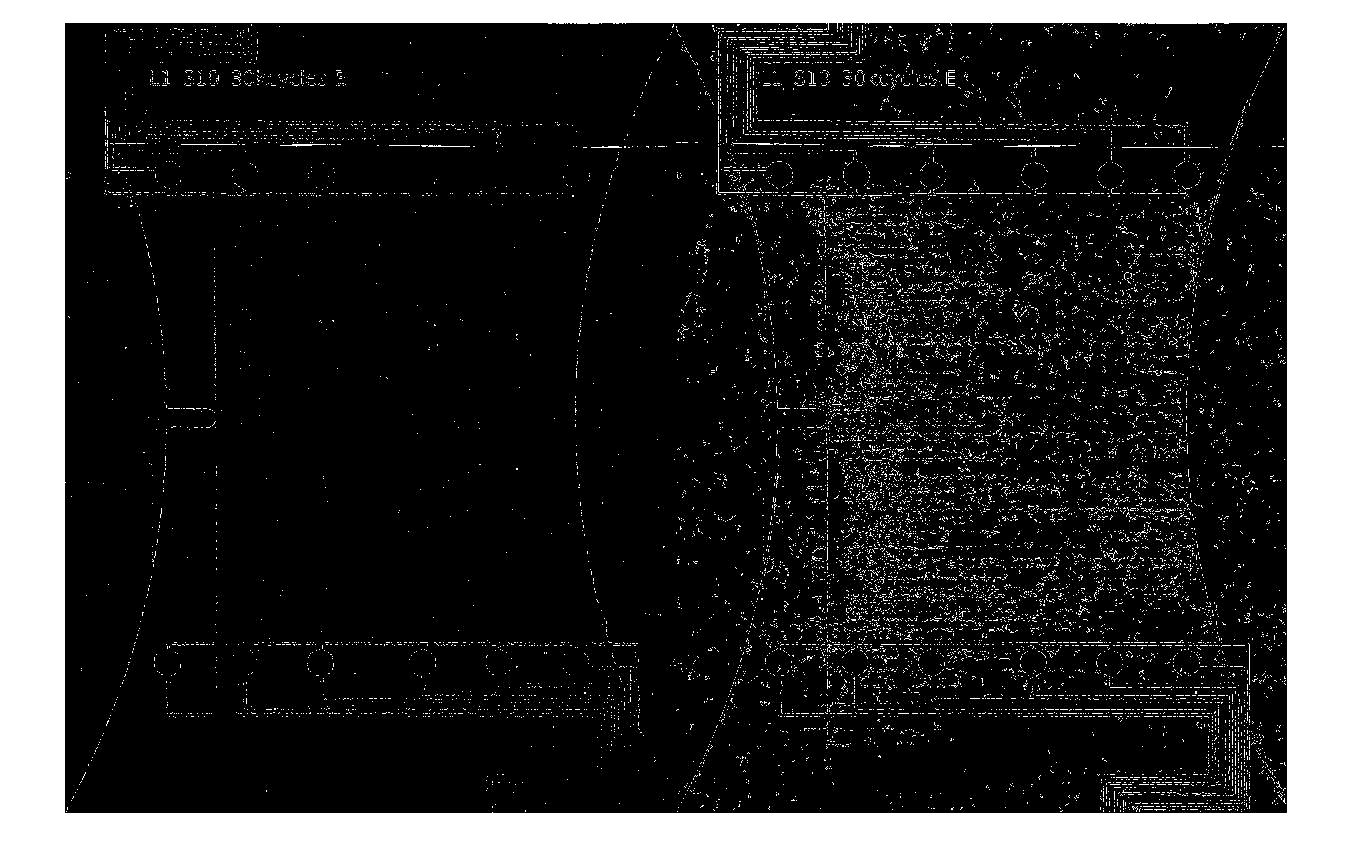
Another approach is to compute the total white pixels within the second concave shape of the binarized image, which contain the delamination area. This method did not yield accurate results, since the binarizing process was not ideal. An adapted threshold parameter was used for binarizing, this worked well for detecting edges and cracks; however, the bright pixels within the delamination area were surrounded with other bright pixels, which made them appear as dark after the binarizing process.
Another unsuccessful approach was to detect edges using Canny edge detector and the Sobel edge detector. Both methods indicated the edges of the sample, but they did not perform well on the delamination area. The parameters used in all methods were tuned several times, but they did not yield accurate results that can be used in the project.
Tung Lai (Cedar)